Station Health Agent
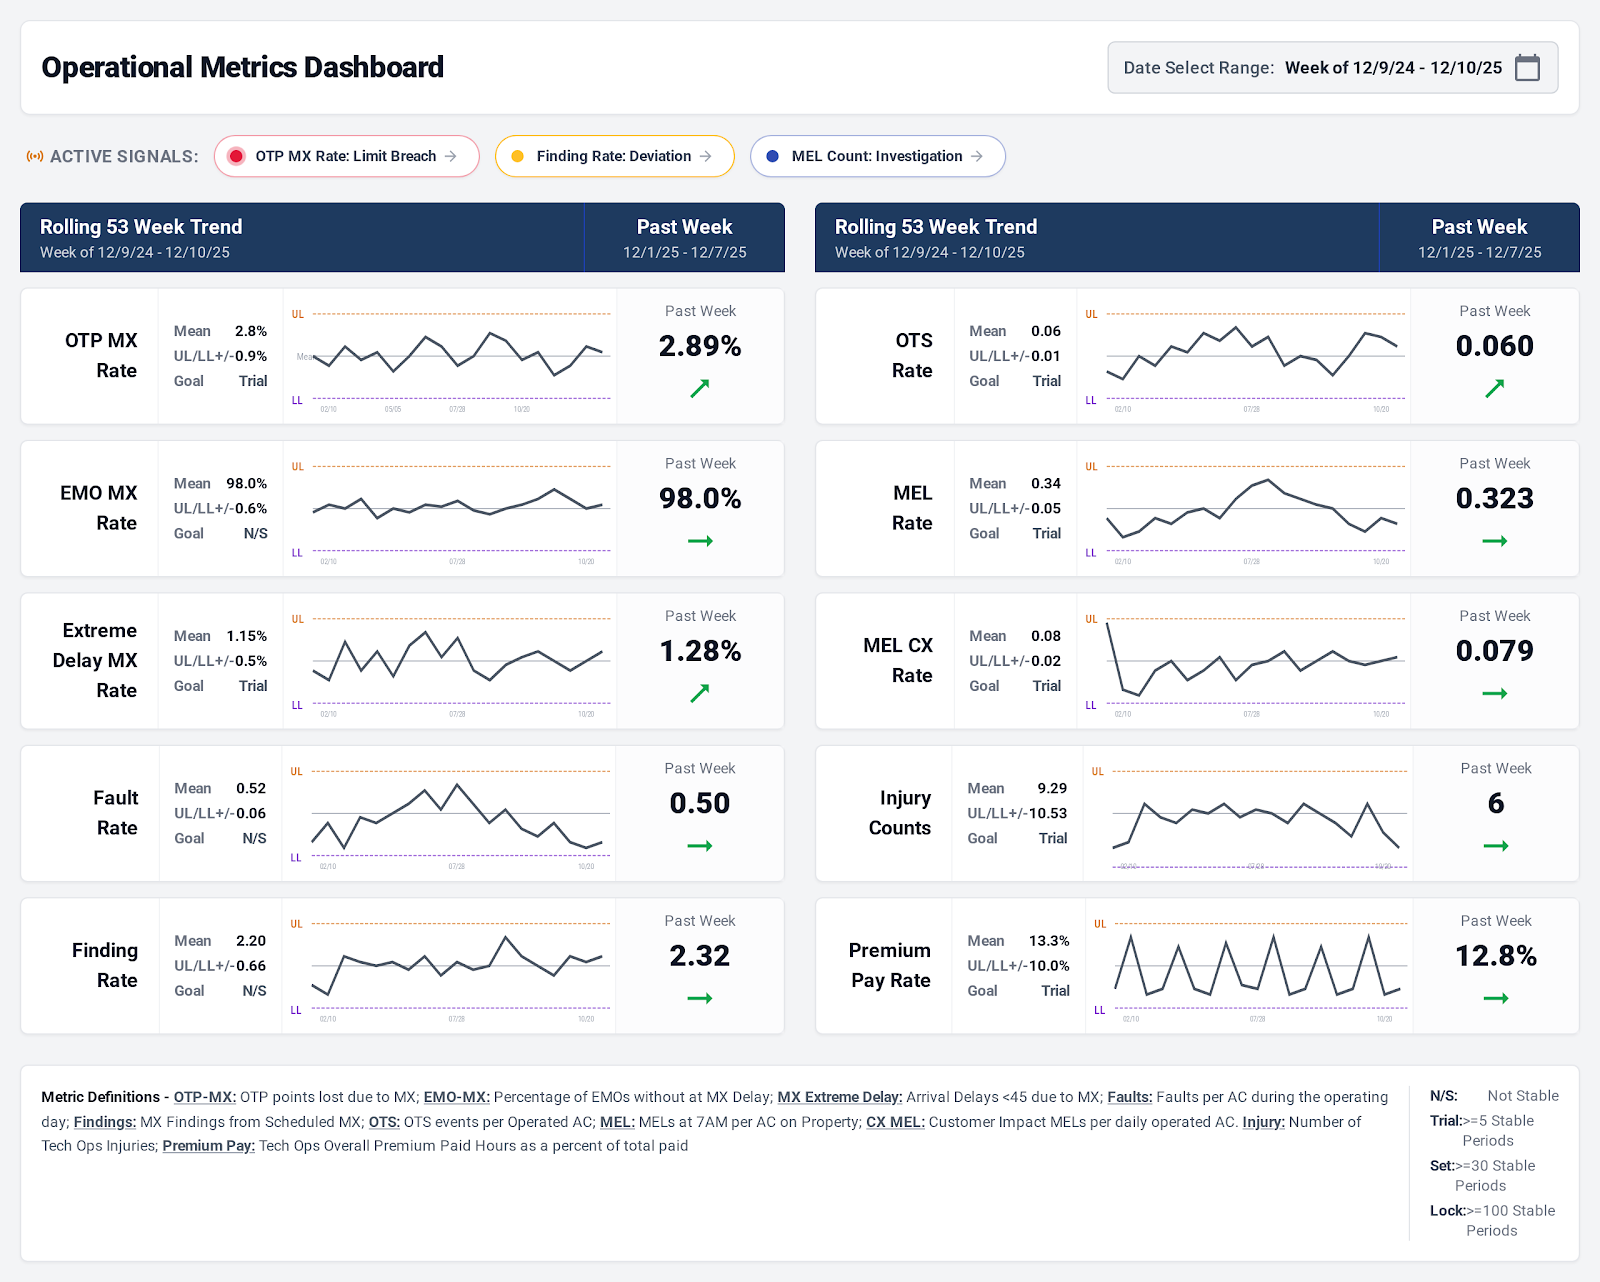
Local model required · Test dataProcess-control charts turn operational measurements into signals to investigate. This existing project capture shows ten metrics, their trend lines and control limits, active signals, and the most recent week's values.
The source also includes time and stage controls and investigation screens. Those screens are not pictured in this saved capture.
Status and next steps
The prototype is designed to move from an observed signal through statistical evidence and conversational local-model investigation, then into a narrative for weekly reporting. This screenshot is a visual example, not a live AI session.
The current local-model connection needs repair. Investigation saves are in memory; durable storage and the weekly-report workflow remain unfinished. No model-generated result is represented here, and no inference runs on this website.